Historical Catchable Pass and Accuracy Chart Project
Since I began covering both the NFL and college football, most notably draft prospects, in 2014, I’ve continually tried to tinker with the contextualization of what I’m seeing and how to interpret it. Some are familiar with my cornerback charts, which in two years seemed to have some potential correlation with predicting future results. It’s a project I enjoyed but it is time-consuming and nearly impossible to continue as far as relating it to draft prospects to the sparse availability of all-22. That same limitation doesn’t exist for every position, though.
When covering the Miami Dolphins in 2014 and 2015 for Bleacher Report, I dabbled in charting catchable passes for both Ryan Tannehill and the team’s opposition for the week in an attempt to see how consistent NFL quarterbacks were throwing with accuracy. Completion percentage is misleading for many reasons, as it’s inflated by dump-off passes and some luck, while it can also be harmed by drops and throwaways. Some completions weren’t reasonably accurate passes, forcing the receiver to make an extraordinary effort to make the play. I didn’t want to punish or over-reward quarterbacks based on traditional statistics, which is the same mantra I had for the Coverage Productivity charts.
So the past two years I decided to break down the film and add my own subjective context to it without the guarantee that these accuracy charts would bear any potential links as far as predicting future events or success. As with all data aggregation efforts, there’s not going to be one number that is overly effective. Some quarterbacks are great despite middling accuracy because they offset their flaws with rare traits or skill sets, and that’s where these numbers stand to be more of a contributing force than an end-all be-all.
The NFL charts will eventually come, as my goal is to go as far back in NFL Game Pass to create a catalogue of information and capture a career in this scope. There’s a lot of information to sift through and not all of it is important, but helps capture who this player was. The NFL part of the project will be much easier to interpret than my current collegiate prospect endeavor, though due to the common foes and similar surrounding casts in comparison to what collegiate quarterbacks have.
What I’ve been working on this offseason is filling out at least 10 years worth of accuracy charts, specifically focusing on quarterbacks who have either been drafted in the first three rounds of the draft, or have started in the NFL. My 2016 and 2017 catalogue is deeper, and that’ll be the case moving forward. Only a few late-rounders who are practice squad-caliber weren’t charted, but I can always add them if they earn playing time.

The purpose is to unearth potential indicators despite major competition and surrounding cast discrepancies, small sample sizes (former Iowa quarterback had just 190 qualifying pass attempts in 2016) and some data that becomes muddied due to scheme. Ideally, teams would play to the strengths of their quarterback and tailor everything to him, such as Mississippi State and the Dallas Cowboys did with Dak Prescott, and was one reason he was able to step right in and find success. His learning curve was smaller because they asked him to be the same guy as he did was in his final two seasons with the Bulldogs, and with his surrounding cast, he was excellent as a rookie.
On the flip side, we can look at Jared Goff’s dominance at Cal, ranking among the very top in a number of categories, as seen below, and his known struggles as a rookie with the Los Angeles Rams. The data is terrific in comparison to the 35 (and counting) other quarterbacks I’ve charted since the 2013 class, and he consistently made better qualify throws than most of his peers, so why did he look like a disaster with the Rams?
On the flip side, we can look at Jared Goff’s dominance at Cal, ranking among the very top in a number of categories, as seen below, and his known struggles as a rookie with the Los Angeles Rams. The data is terrific in comparison to the 35 (and counting) other quarterbacks I’ve charted since the 2013 class, and he consistently made better qualify throws than most of his peers, so why did he look like a disaster with the Rams?
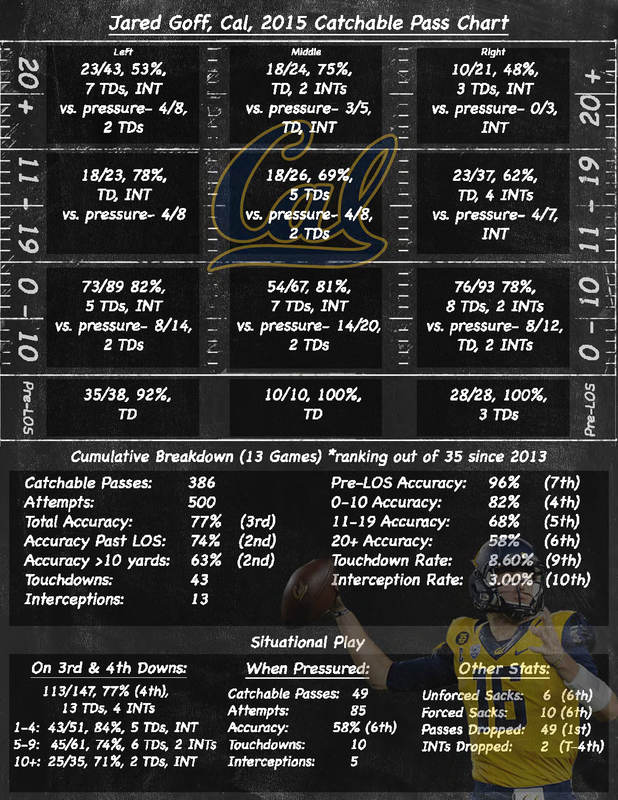
These charts won’t fully explain those answers, but they can help show the usage and supporting cast woes. The data reflects the film, which says the Rams offensive line allowed too much pressure, the scheme was bland, predictable and in no way highlighted Goff’s strengths, and his receivers were awful. It’s possible that even with revamping those three areas that Goff will struggle again, and if he busts, he could go down as a massive miss in this project, and he’ll live on as a great collegiate quarterback who wasn’t able to translate that success into the pros. But the success to all levels of the field and against pressure shows reason for optimism. His chart is very good all-around is strong.
Looking at a still good, but not-as-dominant collegiate case is former Fresno State quarterback Derek Carr. The NFL’s highest-paid player was viewed as a Day 2 pick by many and, I believe, for very good reason. His film showed skittishness when pressured and his footwork often hindered his phenomenal arm. He’s improved in both areas in the NFL and has been a better NFL player than he was as a prospect, but he was still a good prospect.
Looking at a still good, but not-as-dominant collegiate case is former Fresno State quarterback Derek Carr. The NFL’s highest-paid player was viewed as a Day 2 pick by many and, I believe, for very good reason. His film showed skittishness when pressured and his footwork often hindered his phenomenal arm. He’s improved in both areas in the NFL and has been a better NFL player than he was as a prospect, but he was still a good prospect.
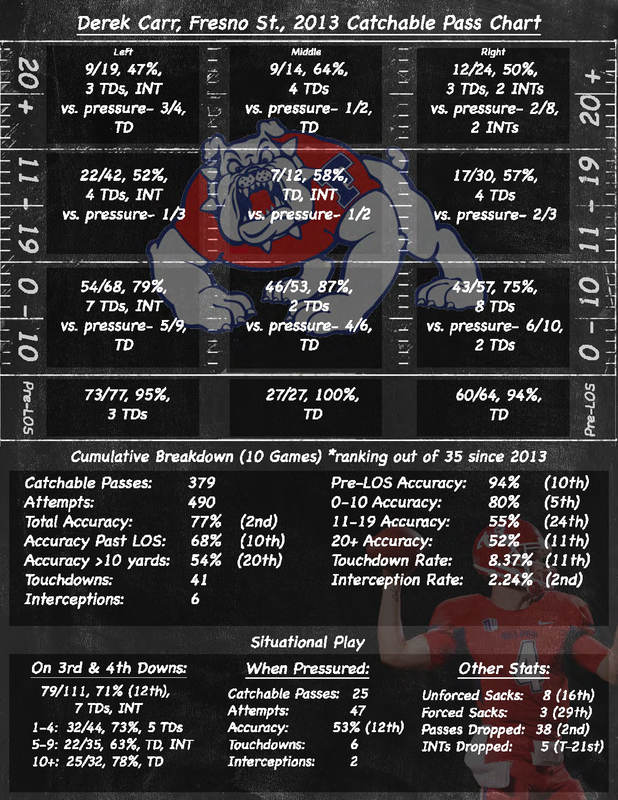
His chart and comparative rankings highlight that he was above-average in most categories and elite in a few. But even in the NFL he’s not known as a precision passer; his big, clutch plays make up for that fact and the variance he provides often swings much more positively than not. His low interceptable-pass rate predicted this. So it’s all part of the evaluation process.
A less successful prospect-turned-professional thus far has been Blake Bortles. His rollercoaster career hit a high in Year 2 as he resembled his UCF-self more than his rookie and third-year, where he was confident even if still winging it more than mastering the position and his reads. His motion was more compact and velocity up, creating a more accurate passer like he was at UCF. As his process breaks down even a little, though, his effectiveness crumbles due to mental errors and the lack of traits to overcome mistakes. As Carr’s arm can trump his footwork at times, Bortles has never had a relatively strong arm.
A less successful prospect-turned-professional thus far has been Blake Bortles. His rollercoaster career hit a high in Year 2 as he resembled his UCF-self more than his rookie and third-year, where he was confident even if still winging it more than mastering the position and his reads. His motion was more compact and velocity up, creating a more accurate passer like he was at UCF. As his process breaks down even a little, though, his effectiveness crumbles due to mental errors and the lack of traits to overcome mistakes. As Carr’s arm can trump his footwork at times, Bortles has never had a relatively strong arm.
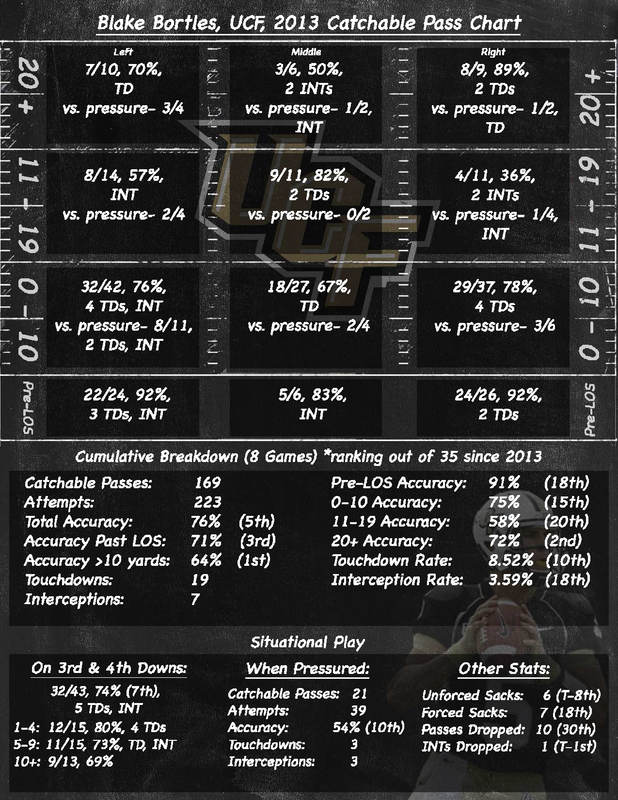
The indicators of this were in his high interceptable-pass rate on intermediate and deep passes, as well as while pressured. Though a ridiculous 74 percent of his touchdowns came on throws past 10 yards, he was benefitting from the scheme and those around him, and struggling in the details that made Prescott so successful as a rookie.
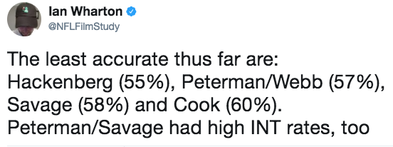
So there’s not necessarily one data set that is guaranteed to predict success. You may have to tinker with several of the points to see the best combination, or revisit the film to see if the data is disagreeing with takeaways, such as it did with the notion that Nathan Peterman is accurate.
So there’s not necessarily one data set that is guaranteed to predict success. You may have to tinker with several of the points to see the best combination, or revisit the film to see if the data is disagreeing with takeaways, such as it did with the notion that Nathan Peterman is accurate.
One thing I’ve consistently seen so far is that these charts are shredding bad prospects. As I get more data, this could be tested or proven even more true, but only Jameis Winston has been a promising player despite average to bad overall results. I like Winston quite a bit, and think his film and variance is worth his weaknesses, but if his career doesn’t turn out as expected, I’ll be able to point out exactly why. If he continues to develop and play well then he’s an aberration of the data and the “scouting eye” wins.
I mentioned the importance of the draft classes prior to 2013 not only because the more data, the stronger all of this becomes, but also due to the quality of the prospects rises. Andrew Luck, Russell Wilson, Robert Griffin and Ryan Tannehill are just the tip of the iceberg of the names to come from 2006-20012 that I’ll chart, and I’ll even have Michael Vick done in the near future. Teddy Bridgewater and Jared Goff have been the two better quarterback prospects since then (along with Winston and Marcus Mariota) and they have been the two best in this project to this point, which could be an indicator of bad quarterback classes (which is generally true) and maybe a flawed system. We’ll find out.
For the future of the project, I’m looking forward to the comparisons we’ll be able to make with prospects with past prospects. The 2018 class is promising and for the first time, I’ll have their previous season’s data to refer to in terms of progression or regression. Eventually I may create an entire catalogue of all this data to sell, and continue to the include the current charted prospects in my draft guides but that’s yet to be determined.
If you have any questions or suggestions for the project, feel free to tweet me, or email me at [email protected].
NOW AVAILABLE - IAN WHARTON’S 2017 NFL DRAFT GUIDE
I’m happy to announce that my 2017 NFL Draft Guide is almost available to purchase and download. The second draft guide I’ve been fortunate enough to self-publish, this iteration raised the bar from my previous work. With an emphasis on the quality of scouting reports, scheme-specific fits and a sleek design, this draft guide effectively captivates my evaluations and projections for 202 of the top draft prospects in this year’s deep class.
There are many draft guides available this time of year, and I appreciate that you’d consider adding mine to your digital collection. I hope you’re able to support as many independent writers as possible, as the time and sacrifices to make this possible is significant. But for just $7, not only are you purchasing this guide, but I have pledged half of all profit to my favorite charity, CurePSP, who support neurodegenerative disease research and treatment.
The 271-page full PDF guide is available to purchase below now. If you're on the fence and not sure whether my guide is for you, take advantage of this opportunity to download a free sampler file, with a first-round mock draft and 10 evaluations. Hopefully this will assist you in your decision-making. Either way, I appreciate your support.
Download the 10-page sampler right here!

